We’ve been doing salary surveys on the ITAM Review since 2014, every two to three years, with the last survey being 2022. Now we’re replacing them with something bigger: the ITAM Review Hiring Index, an ongoing tracker built from advertised roles.
- 2014 Salary Survey Results
- 2017: Global ITAM salaries rise 13.3%, female salaries growing quicker
- 2019 ITAM Salary and Skills Survey: The Results
- ITAM Salary Survey 2022: Salaries, teams and skills all going up!
Why we’re launching the ITAM Review Hiring Index
The previous approach was to survey 200 to 300 practitioners at a time, asking how much they were getting paid and what skills they were most interested in for the future. With the advent of AI, we can now look at ITAM salaries and skills at scale through advertised roles. Introducing the ITAM Review Hiring Index, with two changes. This first edition sets the baseline.
- Firstly, we’re going to do this on an ongoing basis. The snapshot I’m sharing today is preliminary data from the last month, but the real gold will come from comparing month to month, quarter to quarter and eventually year to year. Where are salaries going? Are they going upwards, downwards or sideways? What skills and expertise are most in demand? This is where it starts.
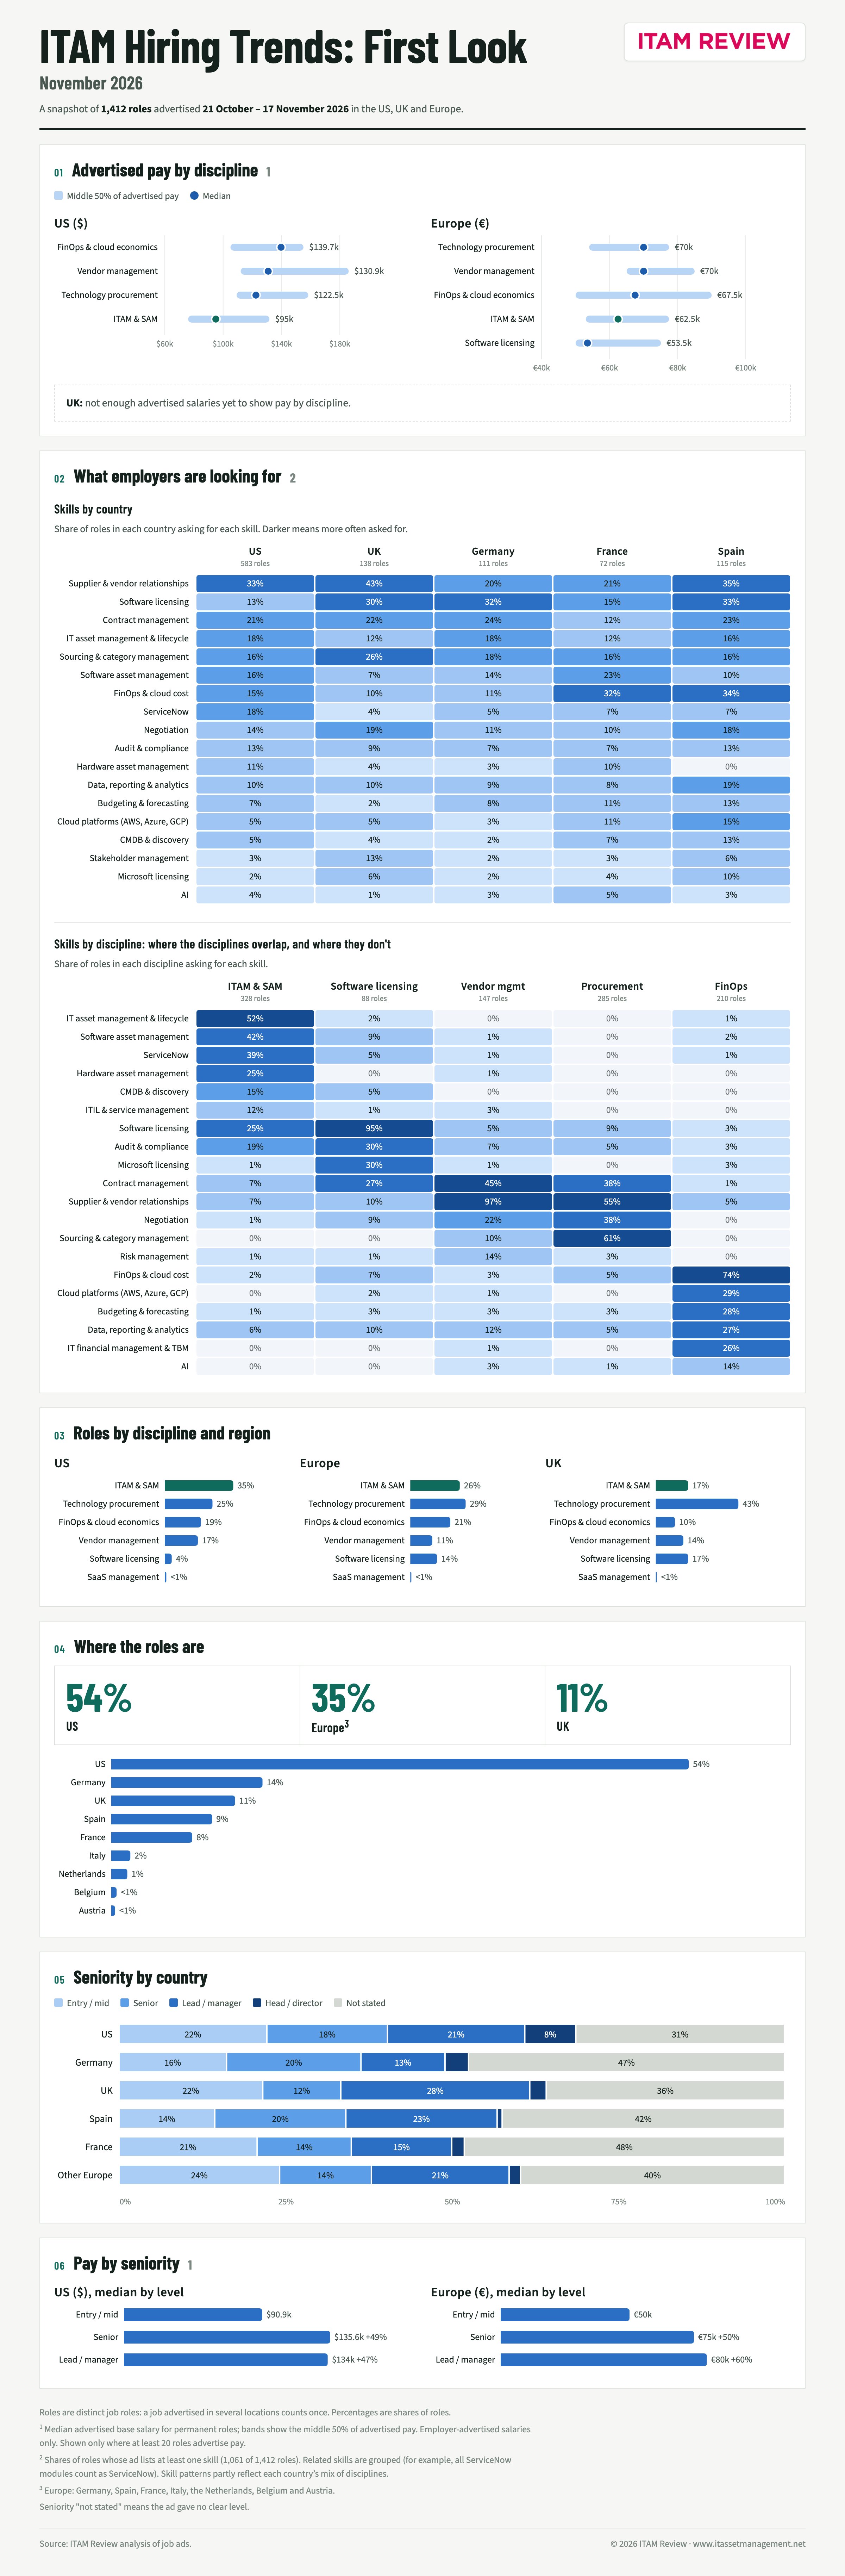
- Secondly, I’ve broadened the scope. We’re tracking vendor management, IT procurement, FinOps and other roles adjacent to ITAM, because I believe all these roles are crashing into each other. There’s a lot more overlap than there used to be, and you can see that in the skills in demand in the infographic.
How we built the ITAM Review Hiring Index
We started with about 10,900 job ads from early searches, refined that down to about 2,300 that were strictly relevant to our criteria, then stripped out the duplicates. Some employers advertised the same role in multiple places. That left us with a core set of about 1,400 roles.
I’m not suggesting this is a comprehensive audit of all the roles being advertised. It’s a snapshot. What we’re looking for over time is changes in trends and demand.
Early observations: pay, skills and transparency
It’s too early to make firm statements about trends because we’re only in month one. But there are some early observations I’d like to investigate further.
- The pay discrepancy between US FinOps and US ITAM roles is quite significant: nearly 50%. Seniority explains some of that, but we want to dig into it in a lot more detail. It’s also interesting that one in seven FinOps ads mentions AI skills, while AI barely shows up in ITAM roles.
- There are significant differences in salary transparency. Any salary figures here come from posted salaries, and we use the midpoint where an ad gives a range. Salary disclosure varies wildly by country, from 81% of ads in Spain to 9% in Germany, so take the comparisons with that pinch of salt. The EU Pay Transparency Directive should push those numbers up. Its deadline passed in June 2026, but most member states are running late.
- There’s much tighter compression between roles in Europe than elsewhere: a lot less difference in pay between different role types, with about a 30% spread between the highest- and lowest-paid disciplines in Europe, against 47% in the US.
- For ITAM specifically, a lot of employers are looking for tooling expertise. ServiceNow is the biggest one by quite a stretch: it appears in 39% of ITAM ads that list skills. The next specialist tool, Flexera, appears in 2%.
- For this first tranche, the UK data was a little thin. We’re looking into that and aren’t sure why yet. There’s no evidence here to suggest UK hiring is light compared with other countries; we’re still working with early data.
What comes next
I’d love to add more countries as the numbers justify it. Historically, the ITAM Review has tracked the US, Canada, the UK, Europe, Australia, New Zealand and India. Those are the markets where we’ve seen the most visitors and engagement. Eventually, perhaps we can look at South America too.
Unlike previous editions, which relied on point-in-time surveys, we’re retaining all the ITAM Review Hiring Index data in a database. That means we can build up a historical record and do long-term trending and analysis.
In the longer term, we’d like to see whether demand is softening in certain areas or countries, or increasing for particular skills and in particular markets. I think that will be useful for the industry.
Tell us what you think
I’d love to hear from you. Is there anything in particular you think would provide useful insights? What else would you like us to add as this develops? And are you surprised by any of the findings?
Want the next edition of the ITAM Review Hiring Index as soon as it’s out? Subscribe to the ITAM Review newsletter and we’ll send it straight to your inbox.